From CTR to Profit: How to Analyze Creatives with AIO 📊
In media buying, creatives are usually evaluated first at the ad account level. CTR, CPC and traffic acquisition costs help show how effectively an ad attracts users, but they do not answer the main question: how much value that traffic ultimately generated. 🤔
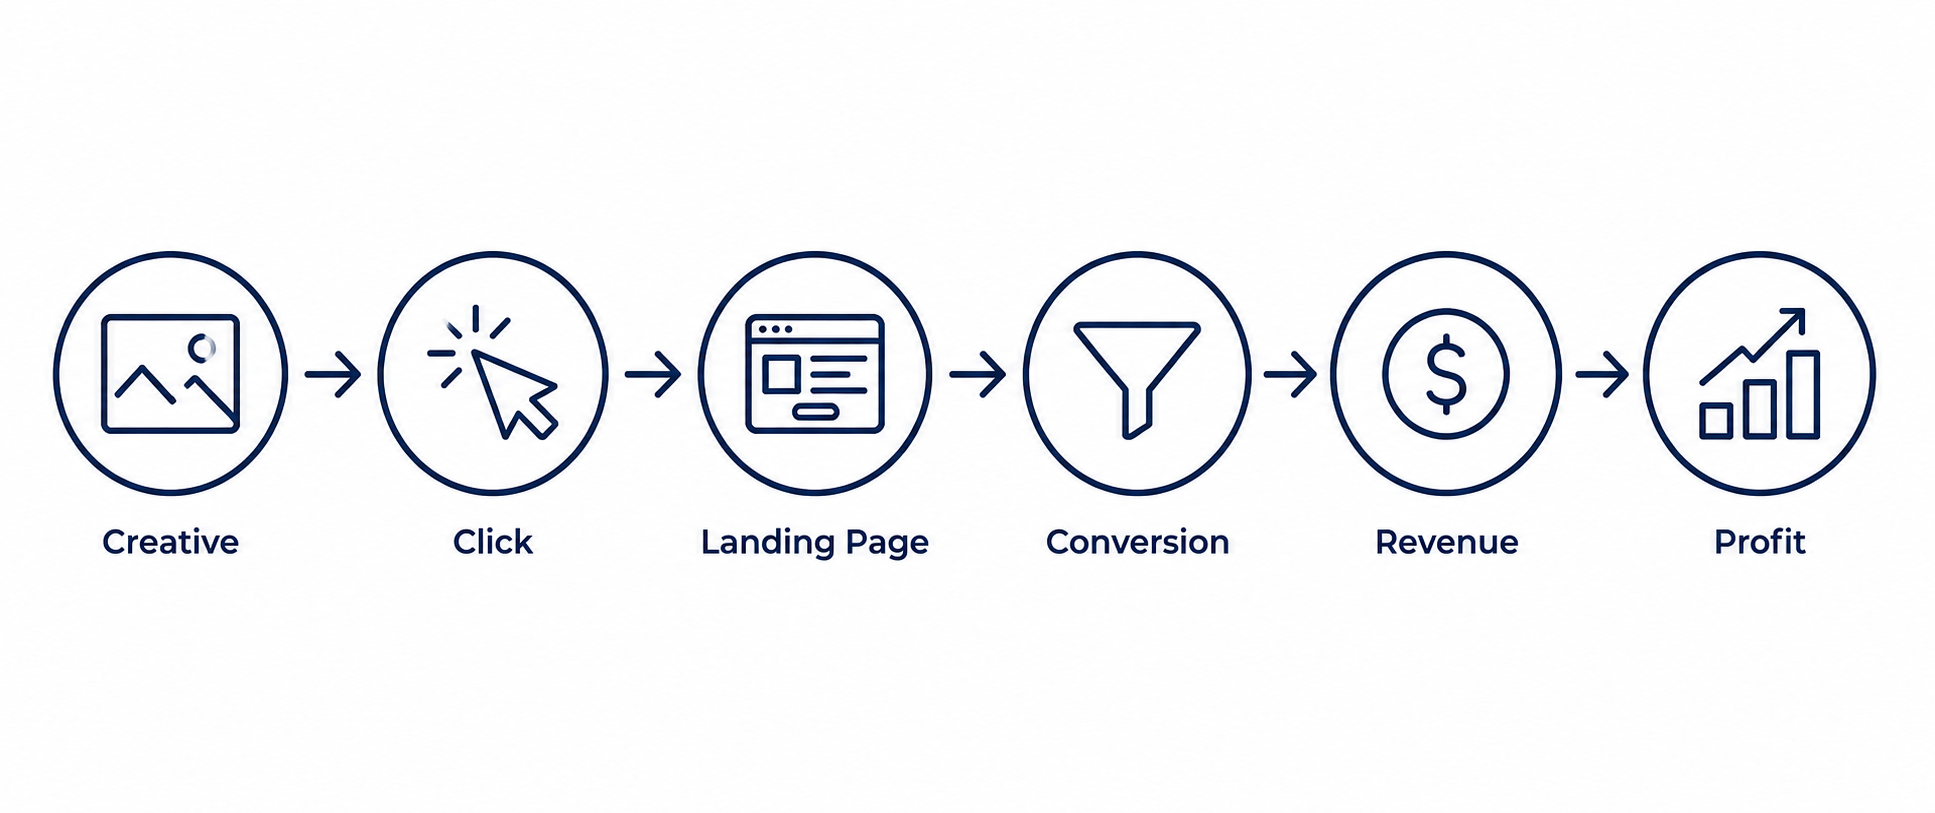
That is not enough to properly assess a creative. If the goal is not simply to generate clicks but to scale profitable combinations, creatives need to be analyzed across the entire funnel – from ad spend to conversion and final profit.
Why CTR Alone Is Not Enough to Evaluate a Creative
A high CTR does not necessarily mean that a creative brings high-quality traffic. The difference between two ads may only become visible after the click. One creative may generate more visits but bring users who convert at a lower rate. Another may drive fewer clicks, while those users move through the next stages of the funnel more effectively and ultimately generate more revenue.
For a media buyer, it is more important to see the connection between a specific ad and what happens next:
The same applies to CPC. A cheap click is not an advantage if the final conversion costs more or ROI is lower. Intermediate metrics are useful for diagnostics, but they should not be the only criteria when deciding which creative to scale.
How AIO Helps Evaluate Creative Performance
In AIO, a creative can be analyzed not as an isolated ad, but as one of the parameters of a campaign. The tracker records each visit and stores campaign and creative data, then connects it with subsequent events across the funnel. As a result, you can see not only how many visits each creative generated, but also how that traffic converts further down the funnel.
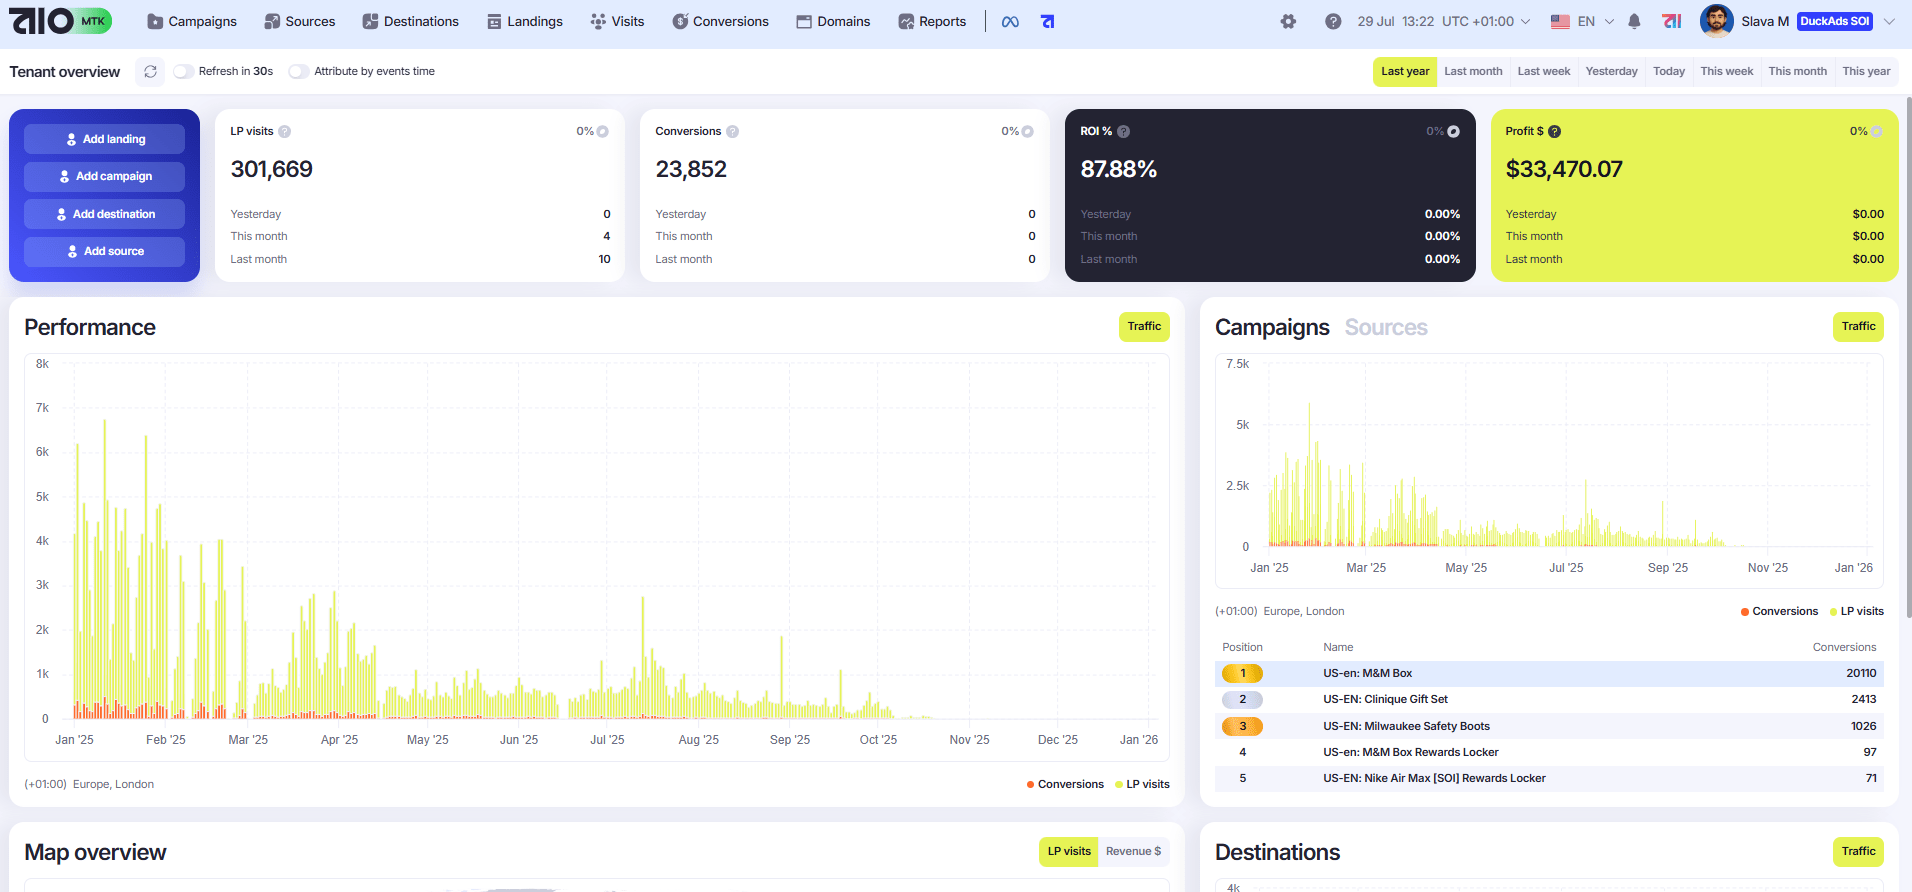
AIO Tracker Dashboard
Ad spend is added to the tracking data, allowing you to compare the cost of traffic from each creative with conversions, revenue and actual ROI in a single report. There is no need to export spend separately from the ad account and then manually match it with tracker statistics.
For example, two creatives may have similar CTRs but perform very differently further down the funnel. In AIO, you can compare how much traffic reached the next stage, where conversion started to decline, and how that difference affected acquisition cost and profit. For more detailed analysis, the data can be segmented by campaign, creative, GEO, traffic source and other campaign parameters. 📊
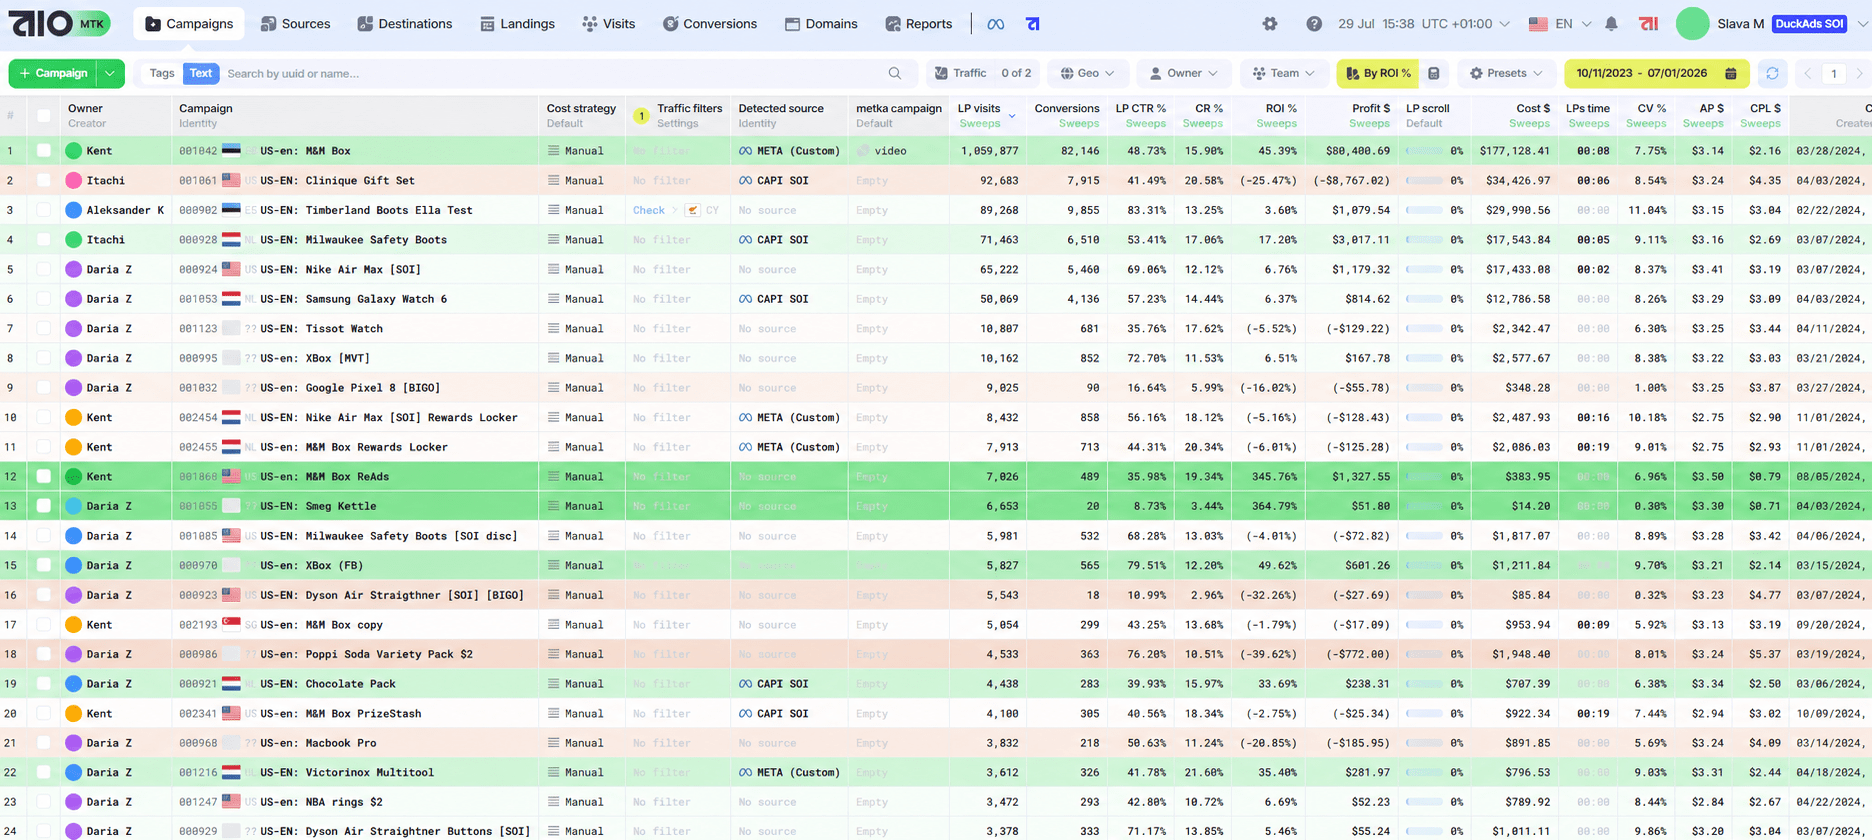
Campaigns in AIO Tracker
You can also compare different periods and changes within the same campaign. After replacing a creative, you can see not only whether CTR changed, but also how conversion further down the funnel and the financial result were affected. This means decisions about continuing a test or scaling a creative can be based on the performance of the entire combination rather than a top-of-funnel metric.
Ultimately, AIO helps answer three practical questions: which creative generates more profit, at what stage the difference between variants appears, and which creative is worth scaling. ✅
How to Test More Than Just the Creative
Creative performance depends on more than the ad itself. After the click, the user lands on a page and then moves to the next stage of the funnel. That is why testing should also show where the difference in performance actually appears.
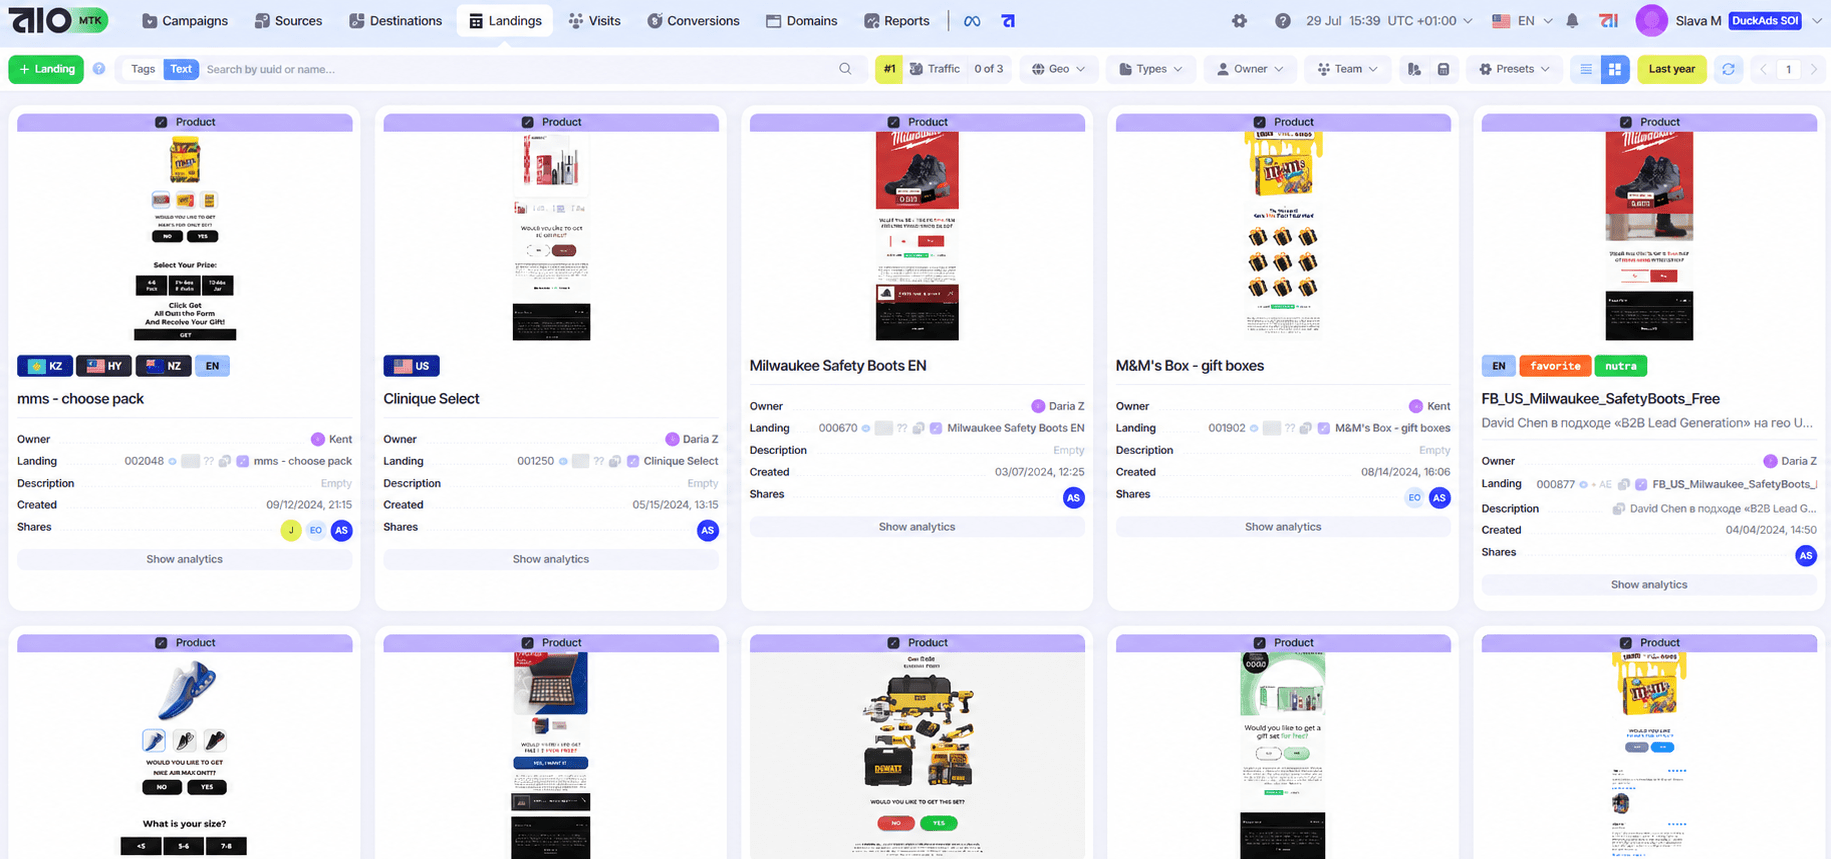
Landing Page Library in AIO
Within a single AIO campaign, you can add multiple landing pages and distribute traffic between them using predefined weights. The same approach can be used to test different destination pages or offers. This makes it possible to compare not only Creative A against Creative B, but entire combinations.
The same creative, for example, may perform differently with different landing pages. If conversion improves after changing the page, the problem was not necessarily the ad itself. This approach makes it easier to identify what is actually affecting the result: the creative, the landing page or the next stage of the funnel. 💡
Analytics and Custom Metrics in AIO
AIO analytics are not limited to standard metrics. Teams can configure the set of metrics around the structure of a specific funnel, which is useful when CTR, CPC, CPA and ROI alone are not enough to evaluate creative performance.
For more precise analysis, AIO supports custom metrics – calculated indicators based on formulas defined by the team.
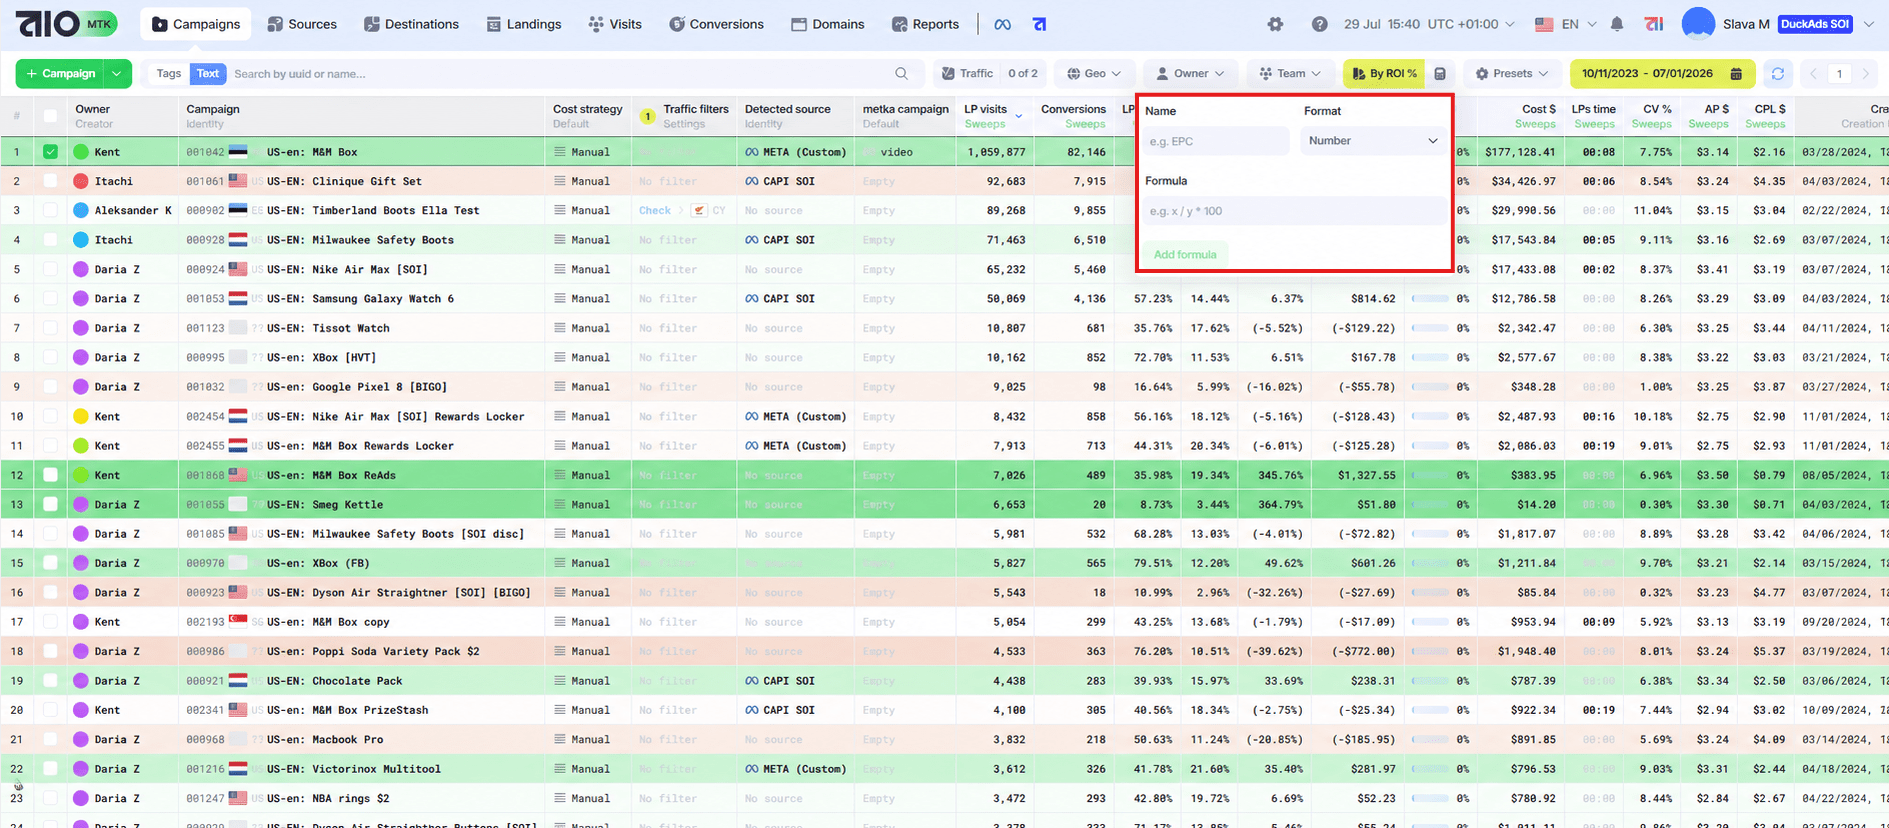
Custom Metrics in AIO Tracker
This makes it possible to adapt analytics to the actual structure of a campaign instead of working with a fixed set of metrics. For creative testing, this is particularly useful because teams can compare not only the final result but also how each variant performs across individual stages of the funnel.
Where to Find New Creatives
Once the analysis in AIO shows which approaches perform best across the funnel, the next step is to find new variants for testing based on current ads in the relevant vertical rather than random references. 🔍
For this, teams can use TYVER, a Facebook ad spy tool. Its database includes ads from gambling, nutra, sweepstakes, and other verticals and is updated daily. Search can be narrowed using advanced filters for keywords and phrases, domains, ad formats, CTAs, Fan Pages, and apps. For some ads, audience reach, gender, and age filters are also available for EU countries.
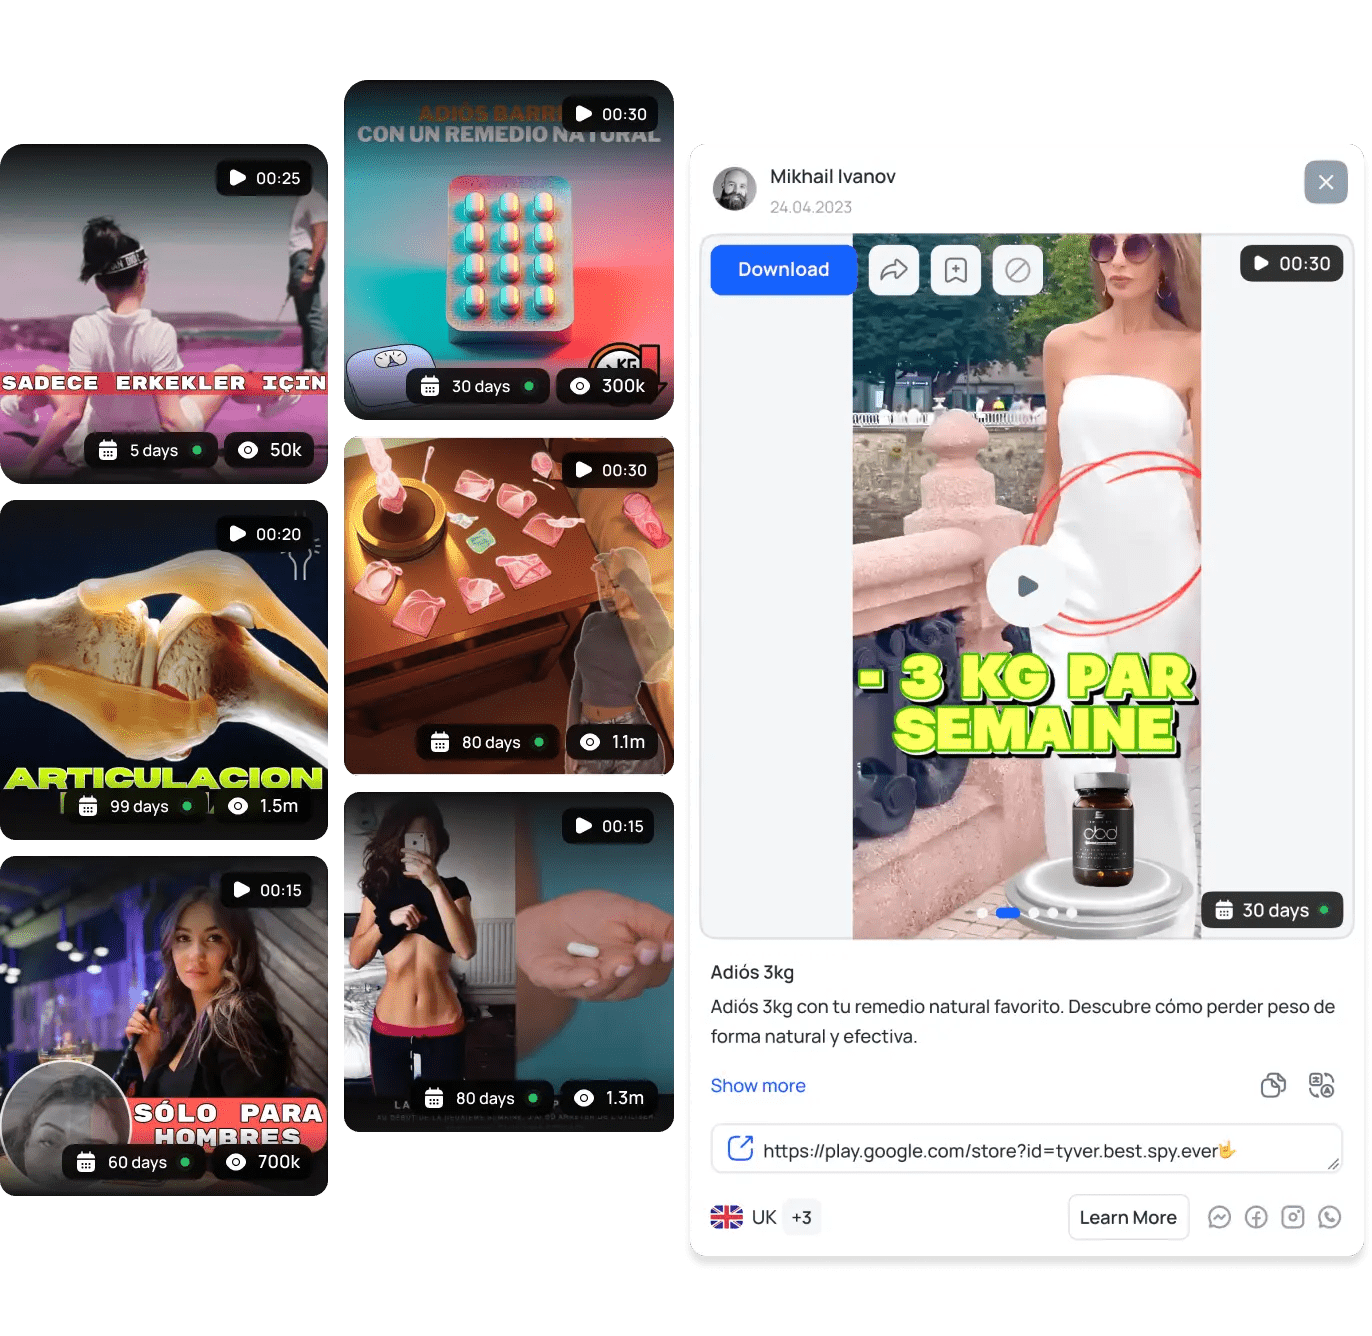
This is useful once a test has already shown which direction is worth developing further. You can find ads built around similar approaches, review other creatives from the same advertiser or use the similar-ads search to quickly build the next batch for testing. Selected ads can also be saved into collections and shared with the team.
Used together, AIO and TYVER create a consistent workflow: TYVER helps find new creatives and approaches to test, while AIO shows which of them actually perform best across the full funnel after launch. 🚀