How to spot creative burnout in time and avoid wasting your budget? Saving ads with Tyver ✅
You launch a campaign and at first get good profits, but then leads become more expensive and ROI goes negative. This does not always mean the offer is “exhausted” — sometimes the reason is creative burnout. The “death” of a creative can be detected in advance, and steps can be taken to extend the life of the campaign. The key is to understand why creatives burn out and to notice the signs of creative burnout on Facebook in time. 👇🏻
Why do ad CTR and lead conversion rates drop?
☝️ The main reason creatives burn out is banner blindness. Users regularly see the same images, text, and offer, and over time they stop reacting.
‼️ There is another reason as well: the most active and profitable part of your target audience gets exhausted first. Facebook tests different audience segments within your targeting and finds “profitable” user layers. Then one part of them makes a purchase, while the other simply isn’t interested in the offer. As a result, it becomes increasingly difficult to find users who haven’t seen your ads yet but are interested in the offer.
How to tell that a creative has burned out?
- Here is what happens when an ad gets “squeezed dry”:
- Impression frequency increases (Frequency): first 1–2 views per user, then 3–4 or more;
- CTR (Click-Through Rate) and lead conversion rate decrease;
- Lead cost goes up. The creative becomes less and less profitable.
Creative burnout in arbitrage happens gradually. That’s why if conversion is worse today than yesterday or the day before, it’s too early to say the creative has burned out. But if the metrics keep declining for at least 5–6 days in a row, it means the ad has started to burn out.
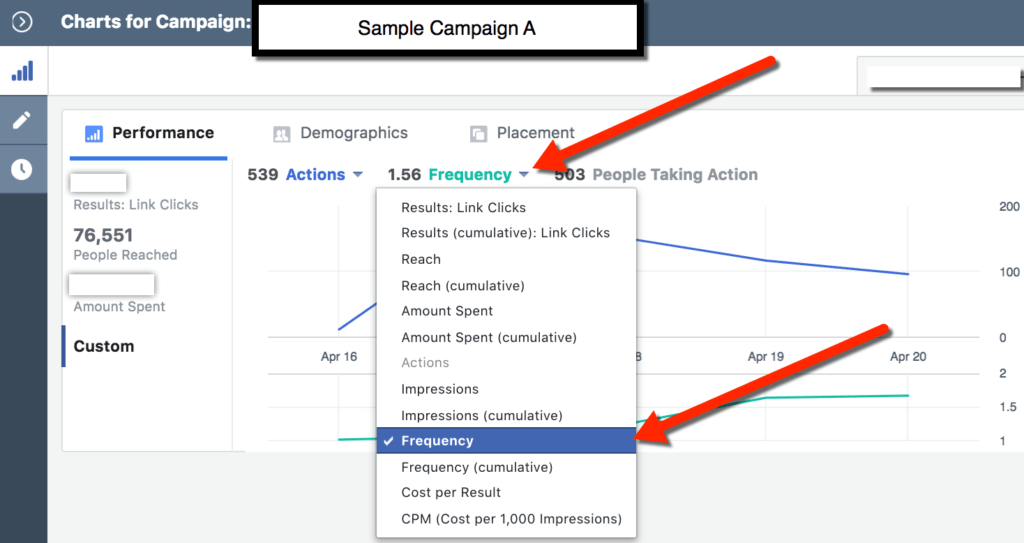 1.56 is a good frequency metric. It means that 100 users have seen the creative 156 times. However, if a week ago it was 1.1, three days ago it was 1.4, and now it is 1.56, this indicates that the creative has started to burn out.
The lifespan of a creative in Facebook targeting ranges from 5–10 days 🗓️ and can extend up to a year. However, the life of an arbitrage campaign can be extended.
Methods to combat creative burnout
You can build a long-lasting campaign and find the right target audience either by trial and error or with the help of spy services. The second option is more reliable. It saves time and money on testing and endlessly cycling through approaches.
Spy filters make it possible to identify creatives that run for months and adapt them to your own offer. Spy tools also show the audience parameters the long-running campaign is targeting, as well as the number of views an ad has received. Let’s look at all these features using Tyver, a spy service for Facebook and other Meta platforms, as an example. 🤔
How to use Tyver to combat ad burnout?
The Tyver ad spy service is a treasure trove of valuable information about the experience and results of everyone who has launched ads on Meta. It offers search by keywords, targeting, and other filters, making it easy and fast to find the data you need. 📊
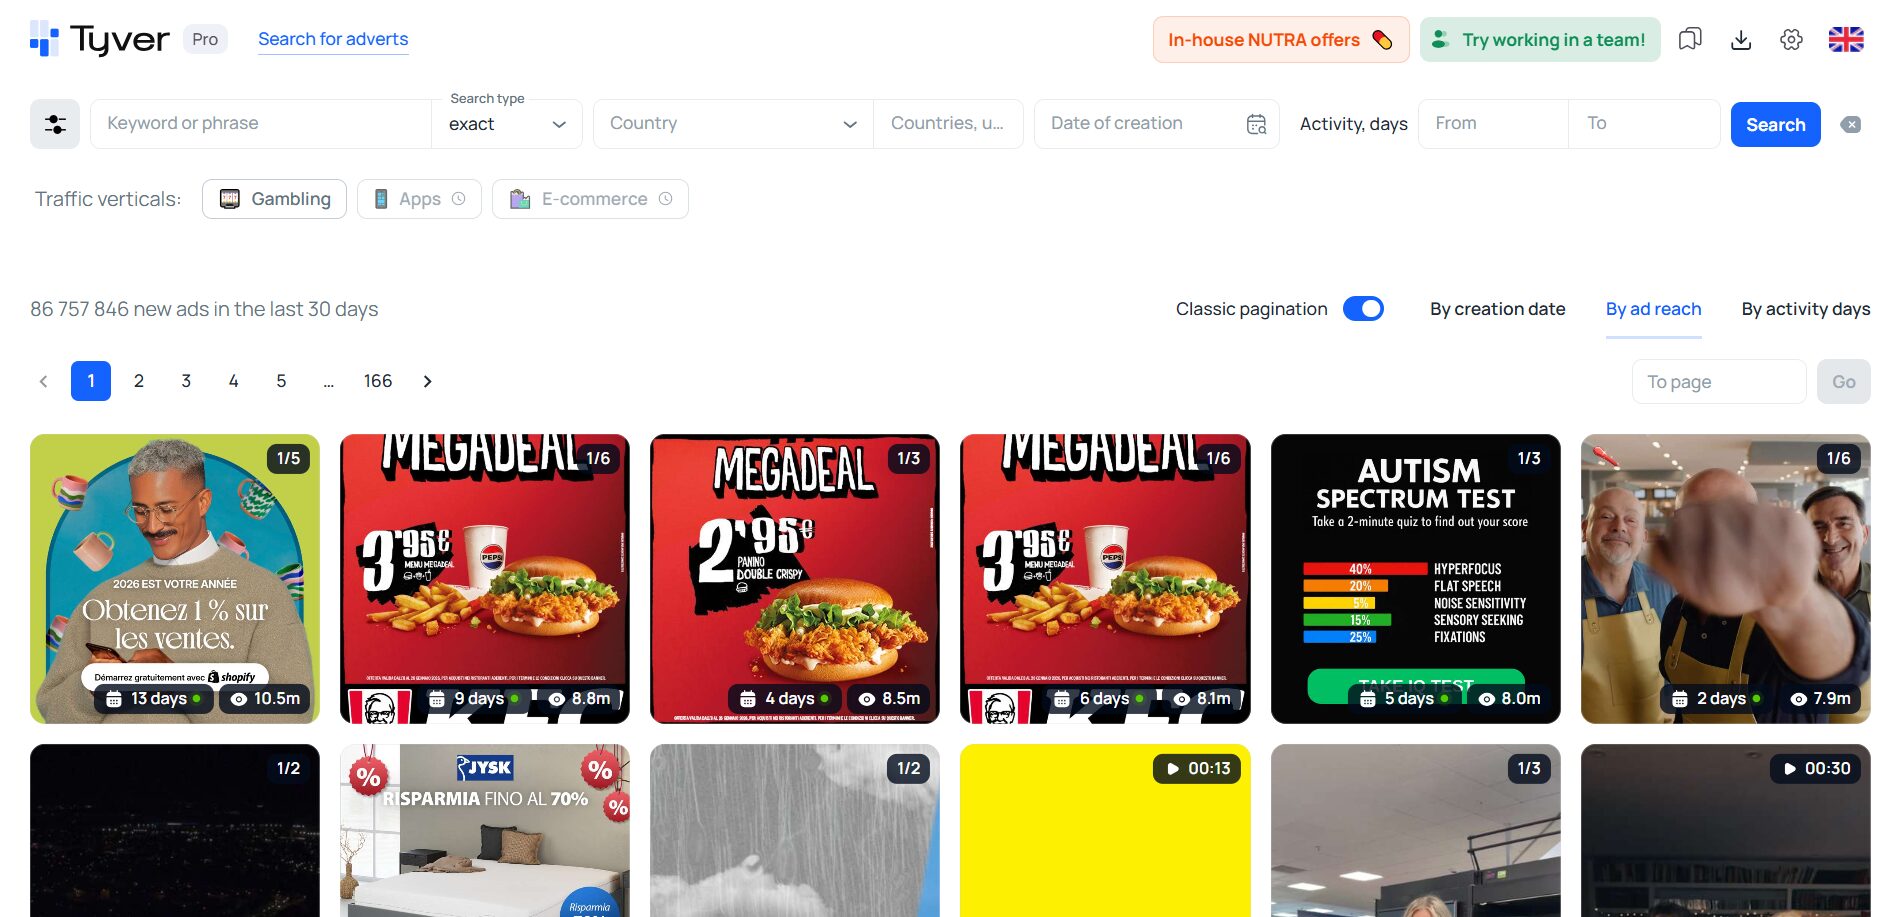
Tyver also shows the launch and stop dates, GEO, fan page, platforms where the creative is running, and similar creatives. The duration of the run and reach make it possible to understand which products and services, as well as which targeting parameters, are currently trending. This information is sufficient to determine whether an offer is burning out or not.
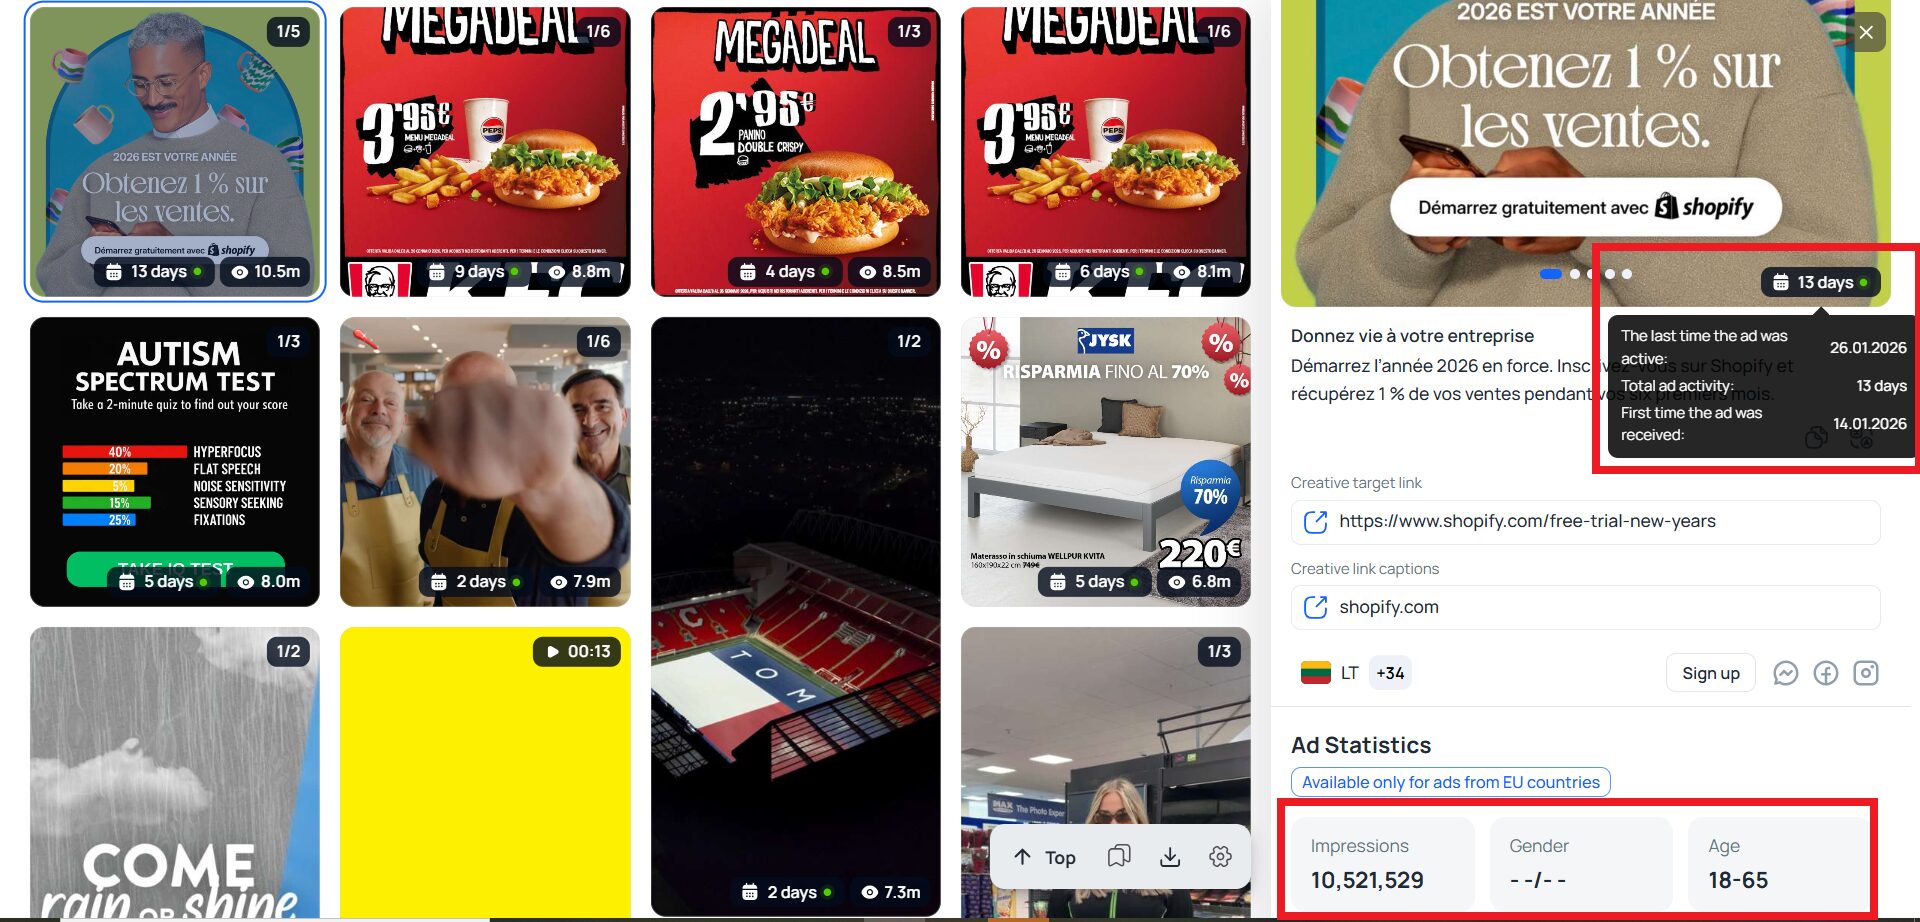
🌎 If an ad is running in Tier-1 GEOs, you can see the number of views as well as the gender and age of the target audience.
How to find effective ads using Tyver?
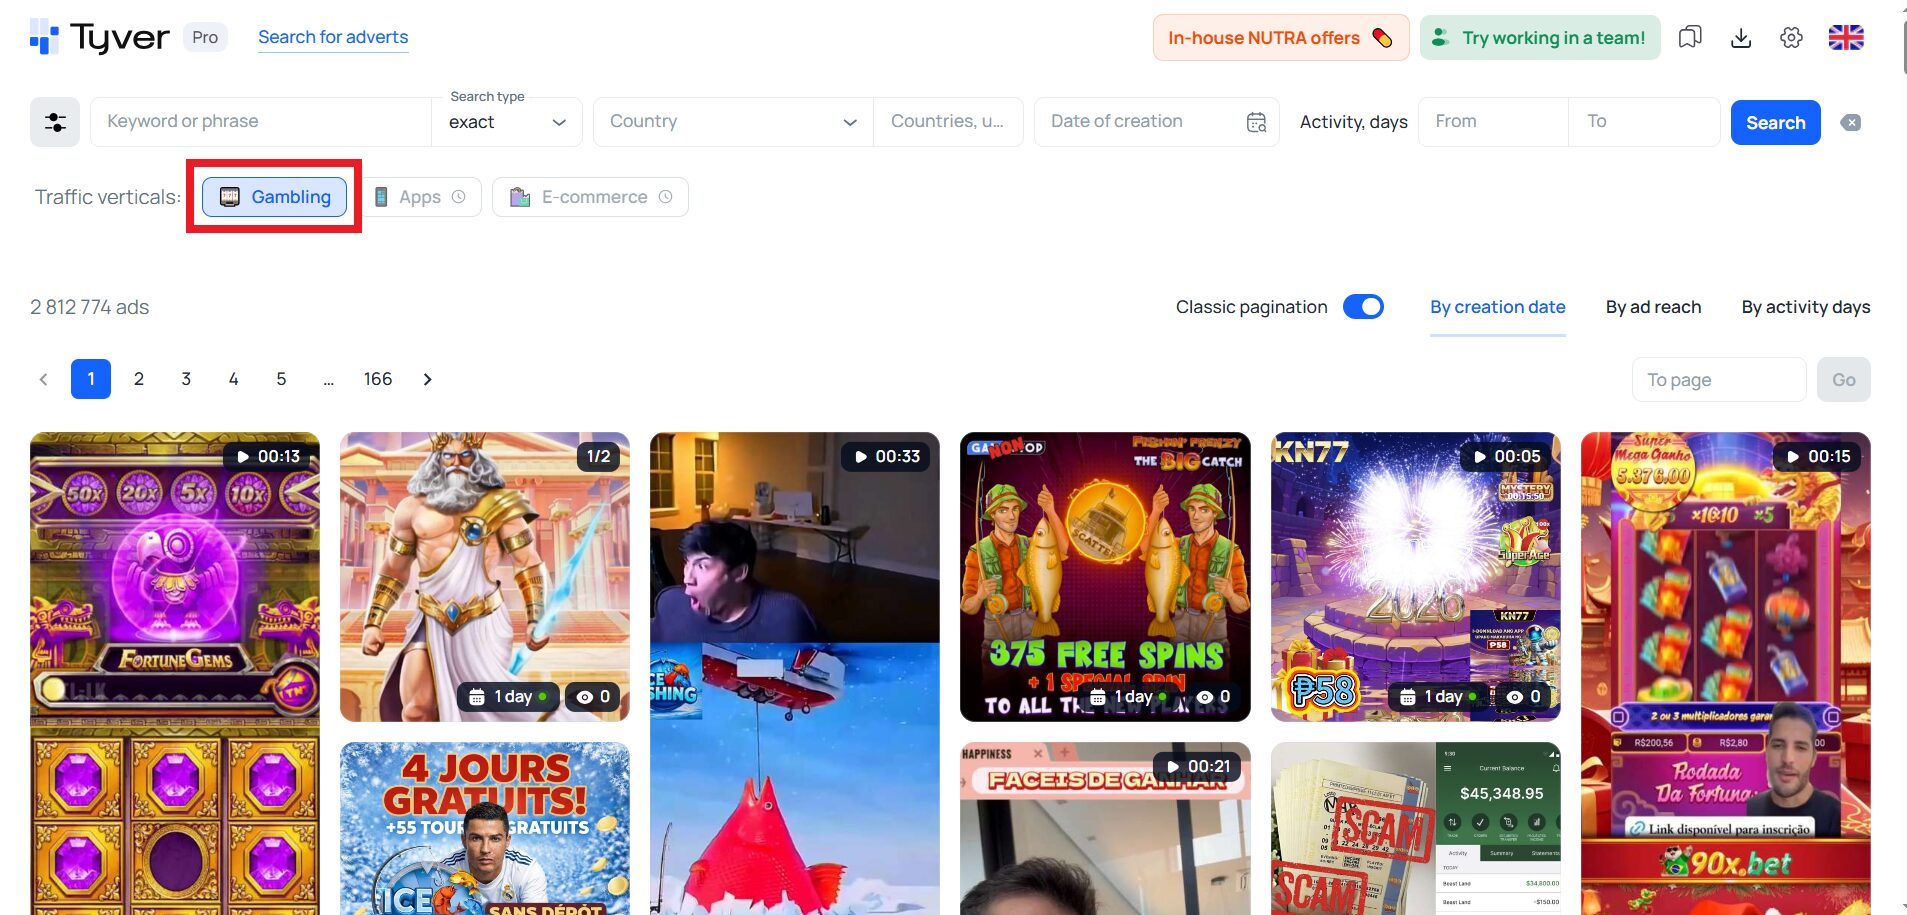
In Tyver, you can’t see ROI/ROAS, Frequency, or campaign profitability. However, to monitor creative performance, it provides reach and ad launch dates, along with filters and sorting options. As an example, let’s find the longest-running casino creatives. Tyver has a dedicated filter — the “Gambling” 🎰 button — for searching ads related to casino offers.
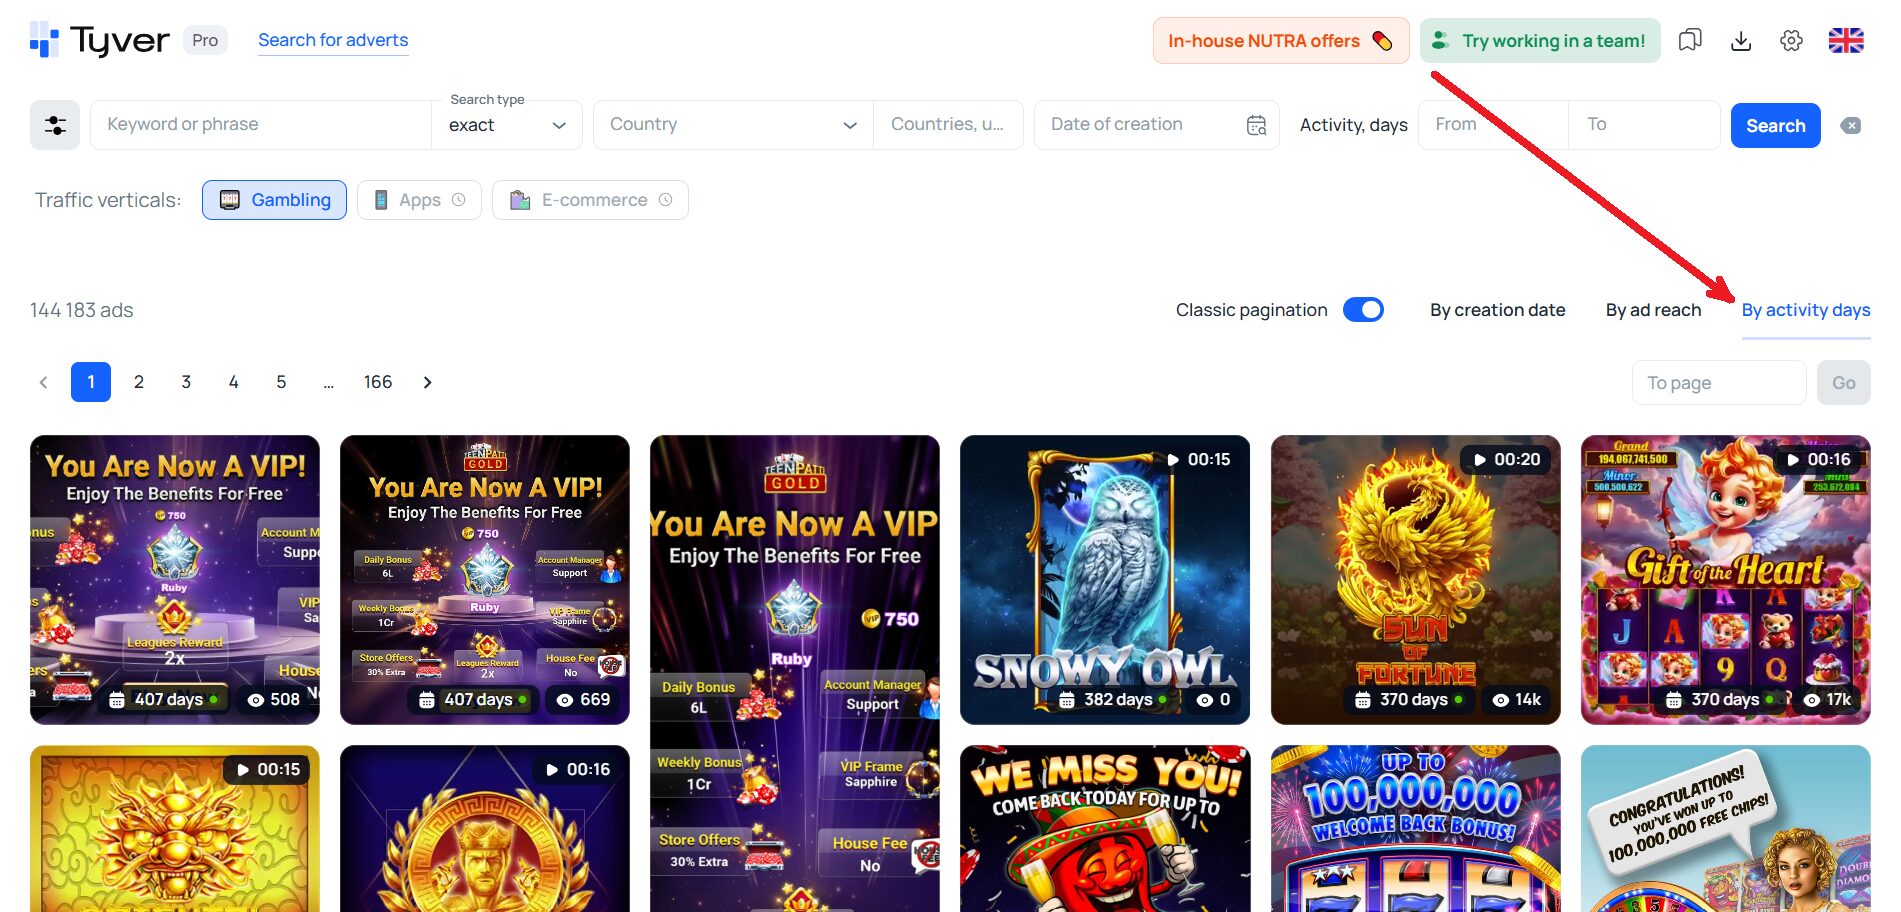
To find the creatives that have been active longer than all the others, we sort the results by days of activity ✅.
Before taking a creative into testing, it’s important to check the GEO and audience parameters. Campaign effectiveness also depends on the country and the target audience 🎯.

⚙️ In the example above, long-running casino advertising follows this formula:
- GEO — Lithuania;
- Gender — male and female;
- Age — 21–55;
- Creative content — an image dominated by gold and purple colors with a concise list of games and a bonus, or a video showing a win with a bonus offer. Gold and purple colors also dominate in the video.
The example above does not mean that if you set up casino ads with the same parameters, they will convert for a long time. You need to study other ads that have been running for months as well.
How to find creatives for any vertical in Tyver?
The developers of the Tyver spy service have not yet implemented buttons like “Gambling” for other niches and verticals. However, you can find nutra, dating, and crypto offers using other methods.
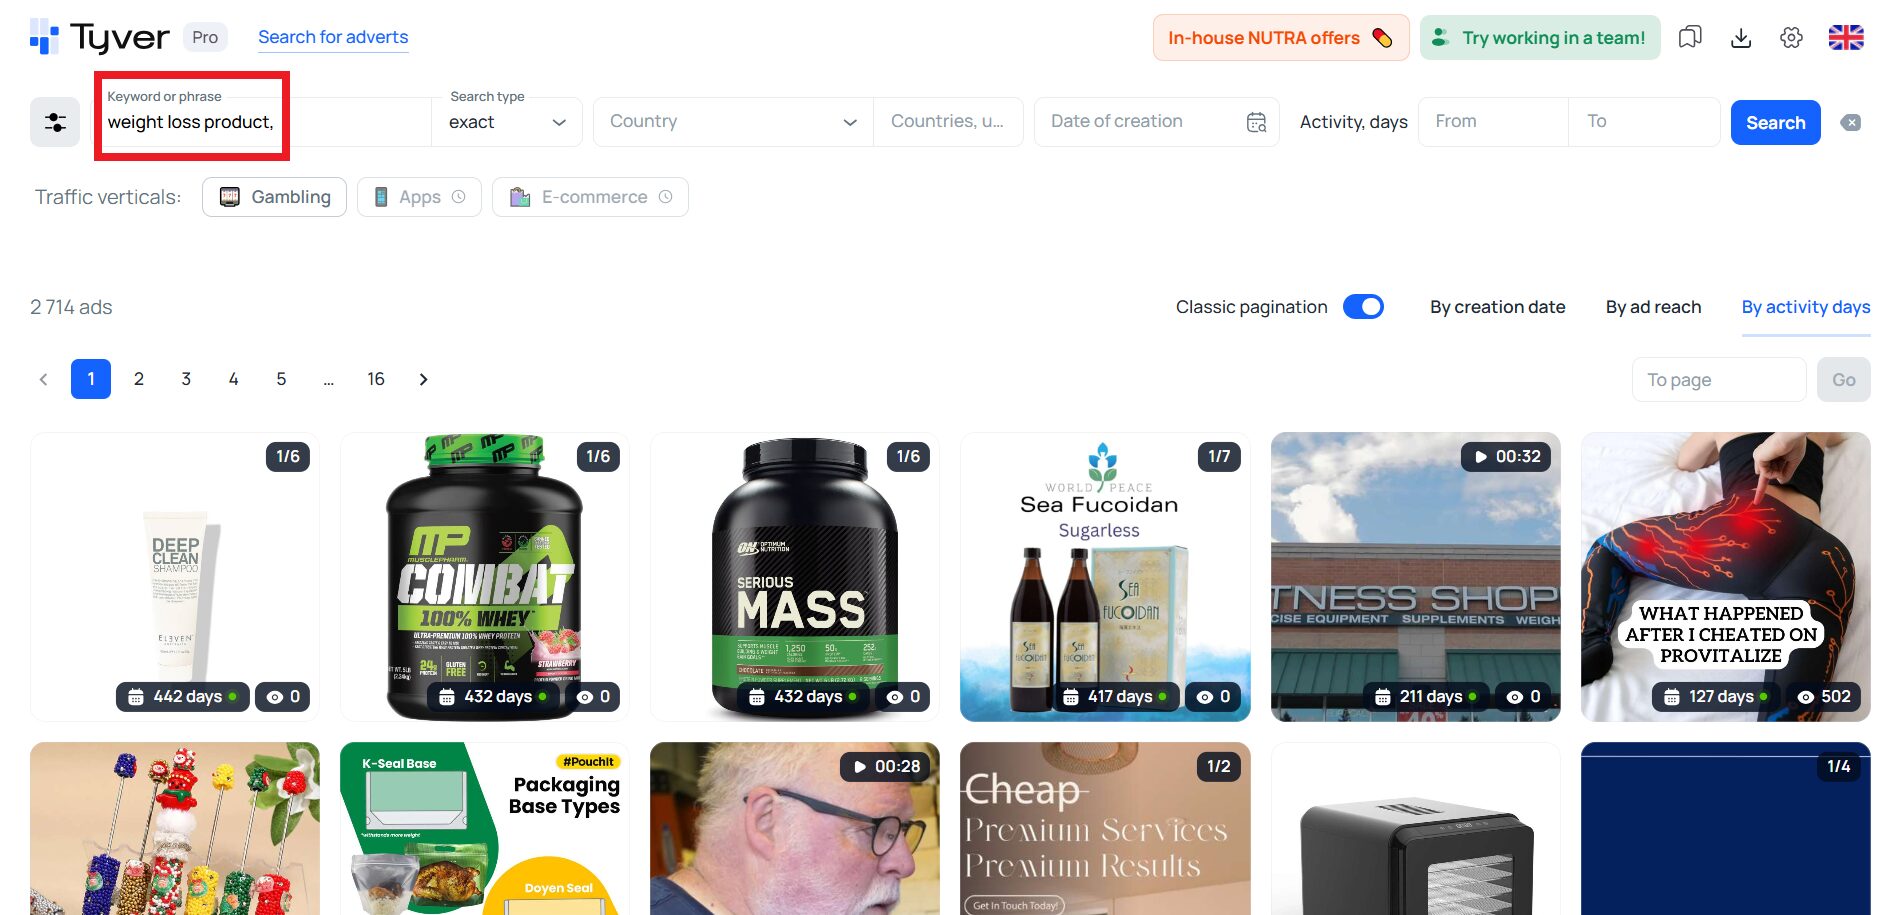
🔷 Keyword search. This is the simplest and most obvious approach. It’s enough to enter a query like “weight loss product”, “Forex” or “crypto,” and the relevant ads will appear.
🔷 Filtering by CTA (calls to action), URL fragments, and e-commerce platforms. The results are filtered when a keyword search returns a large amount of irrelevant advertising.
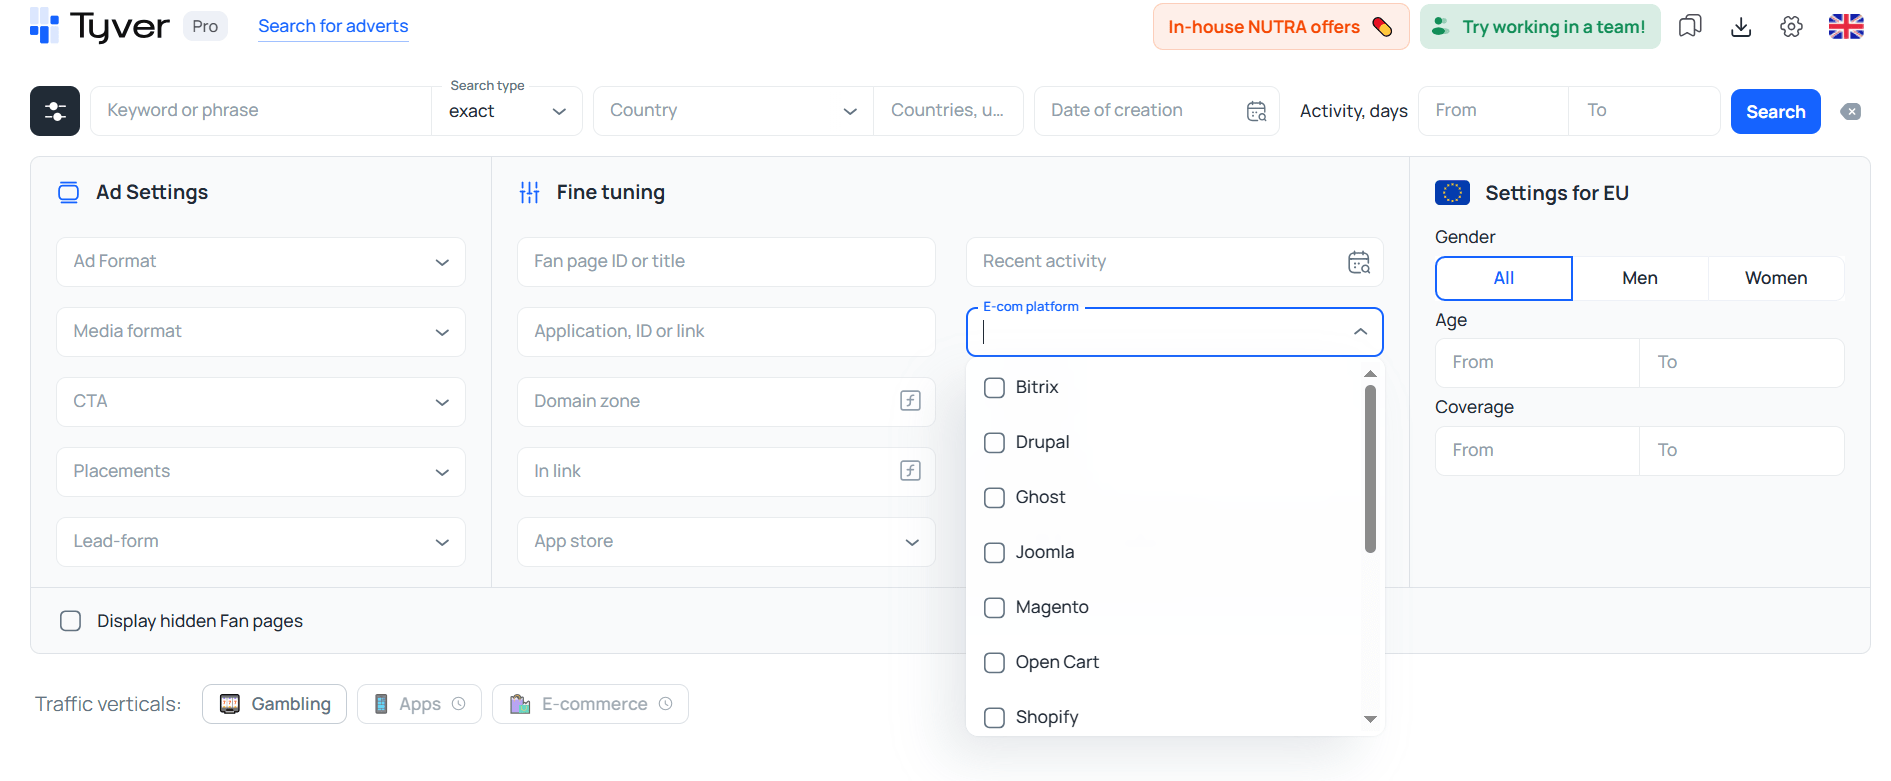
For example, when searching only for products from online stores, you can apply a filter by e-commerce platforms. To leave only arbitrage offers in the results, you should use tracking URL fragments such as pixel_id=, subid=, and similar.
How to find creatives for different GEOs and target audiences?
Tyver has search filters by GEO, language, and target audience parameters. By applying them, you can see which creatives convert for a long time in a selected GEO or audience segment. Let’s look at which creatives perform well in Arab countries.


Everything is almost the same as in the Lithuania 🇱🇹 example. The only difference is that the target audience is slightly broader — 18–65 years old.
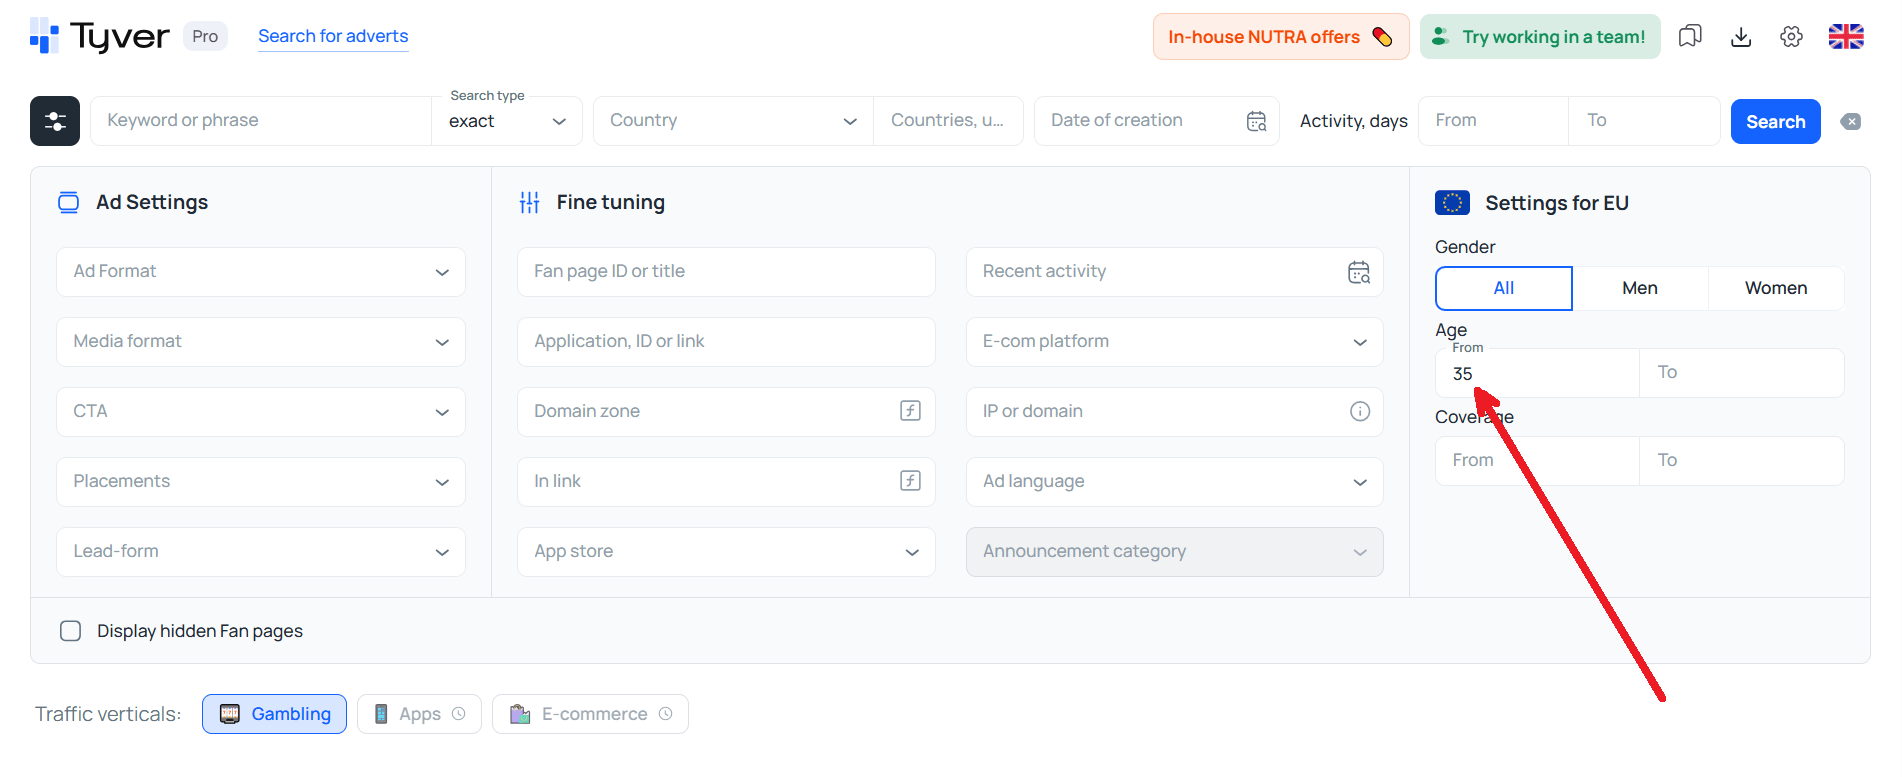
Now let’s limit the audience not by countries, but by age. Suppose we need to run ads for users aged 35+. We set this parameter in the search. We remove the filter for Arab countries, since gender and age targeting is available only for the EU 🇪🇺. Everything else remains the same.
When targeting users 🤓 35+, the results show more “classic” creatives — sevens, slots, jackpots. In general, images that became firmly associated with casinos in the 1990s and early 2000s work better for an older audience.
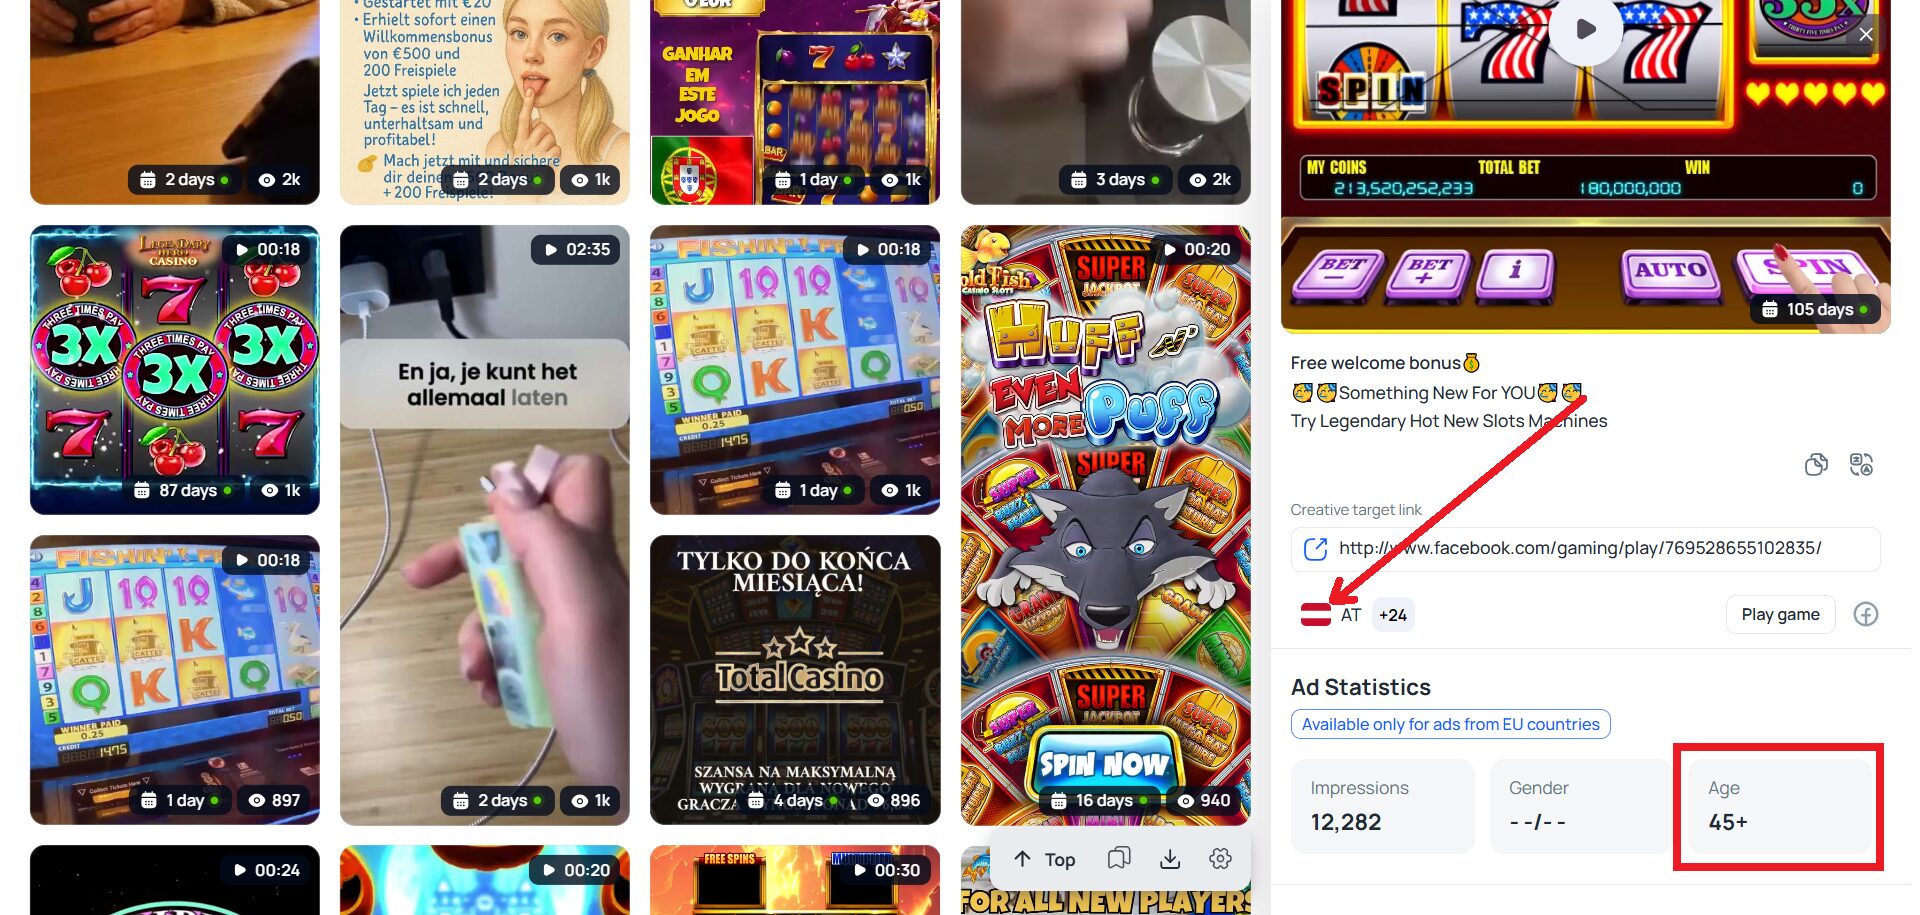
If you apply age targeting, the vast majority of creatives will come from the EU, since age data is shown only for EU creatives. For ads in other countries, age targeting may be displayed — or may not be shown at all.
Analyzing burnout of competitors’ creatives
⭐️ Tyver is not a service for checking ad burnout. However, it allows you to track audience fatigue for a specific offer. At the same time, you can see how an advertiser replaces some creatives with others.
First, you need to find all creatives launched through a single Fan Page. To do this, open a creative from the results and scroll down to “Related ads”.
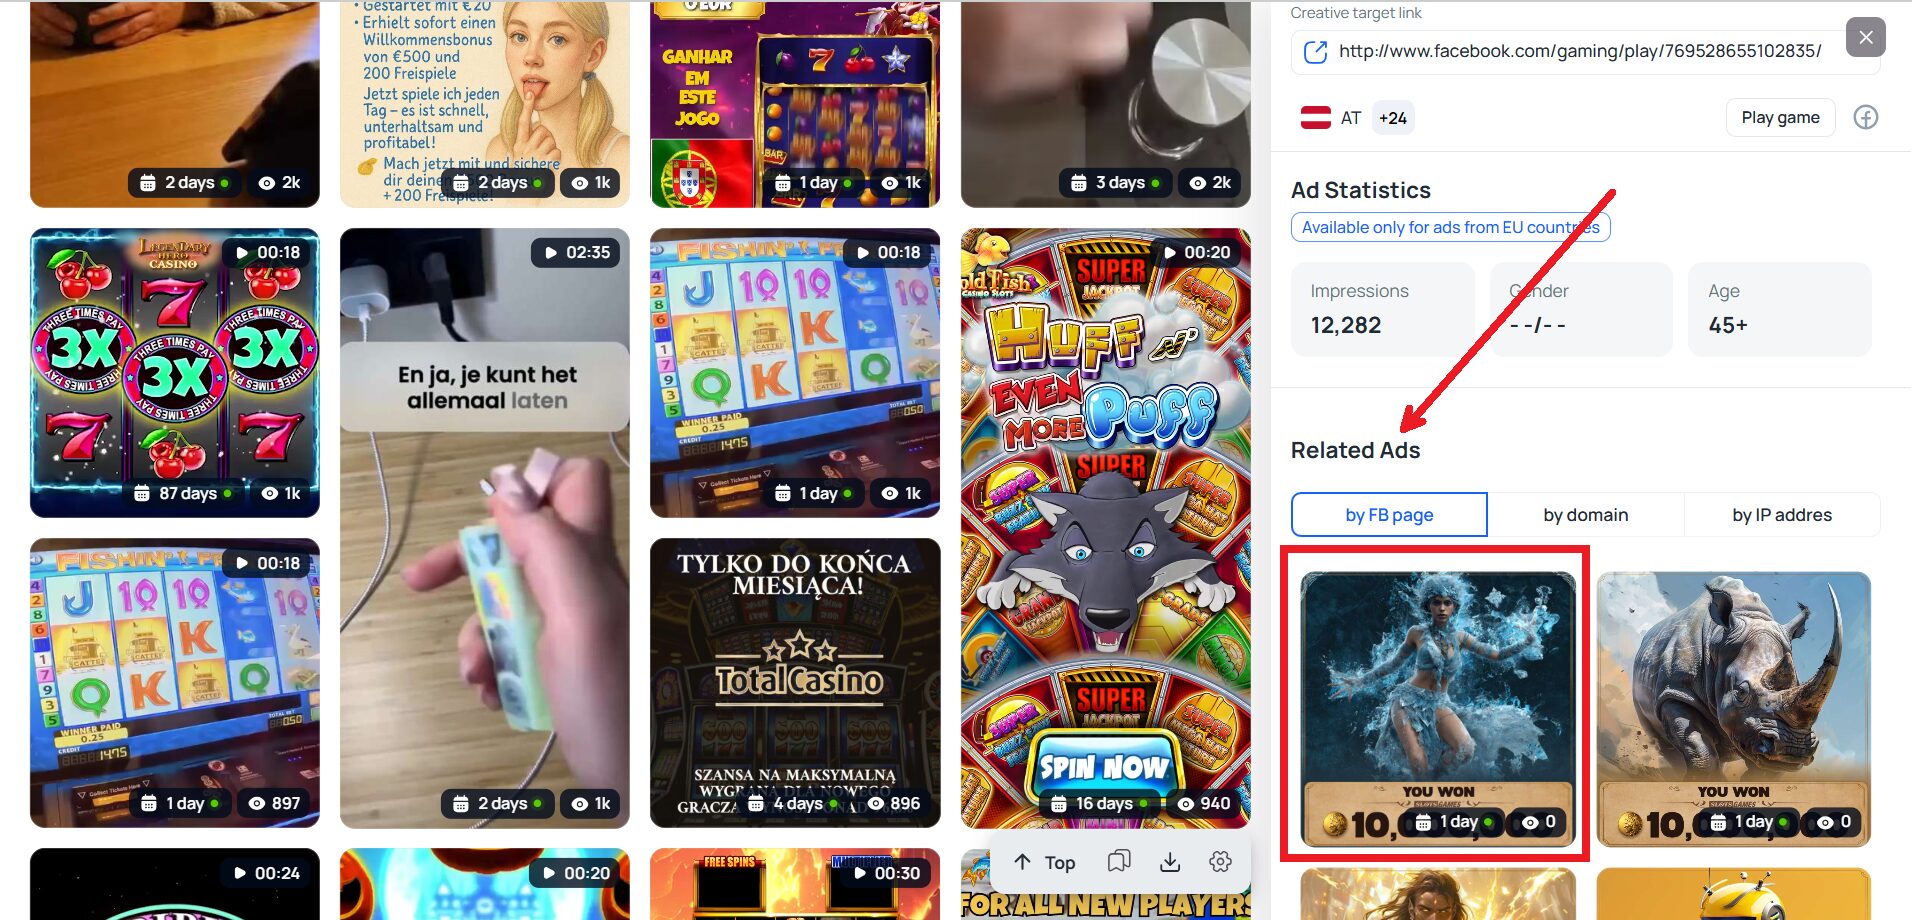
👉🏻 Click on any ad in this section, and a new page opens. It shows all creatives from the same fan page.
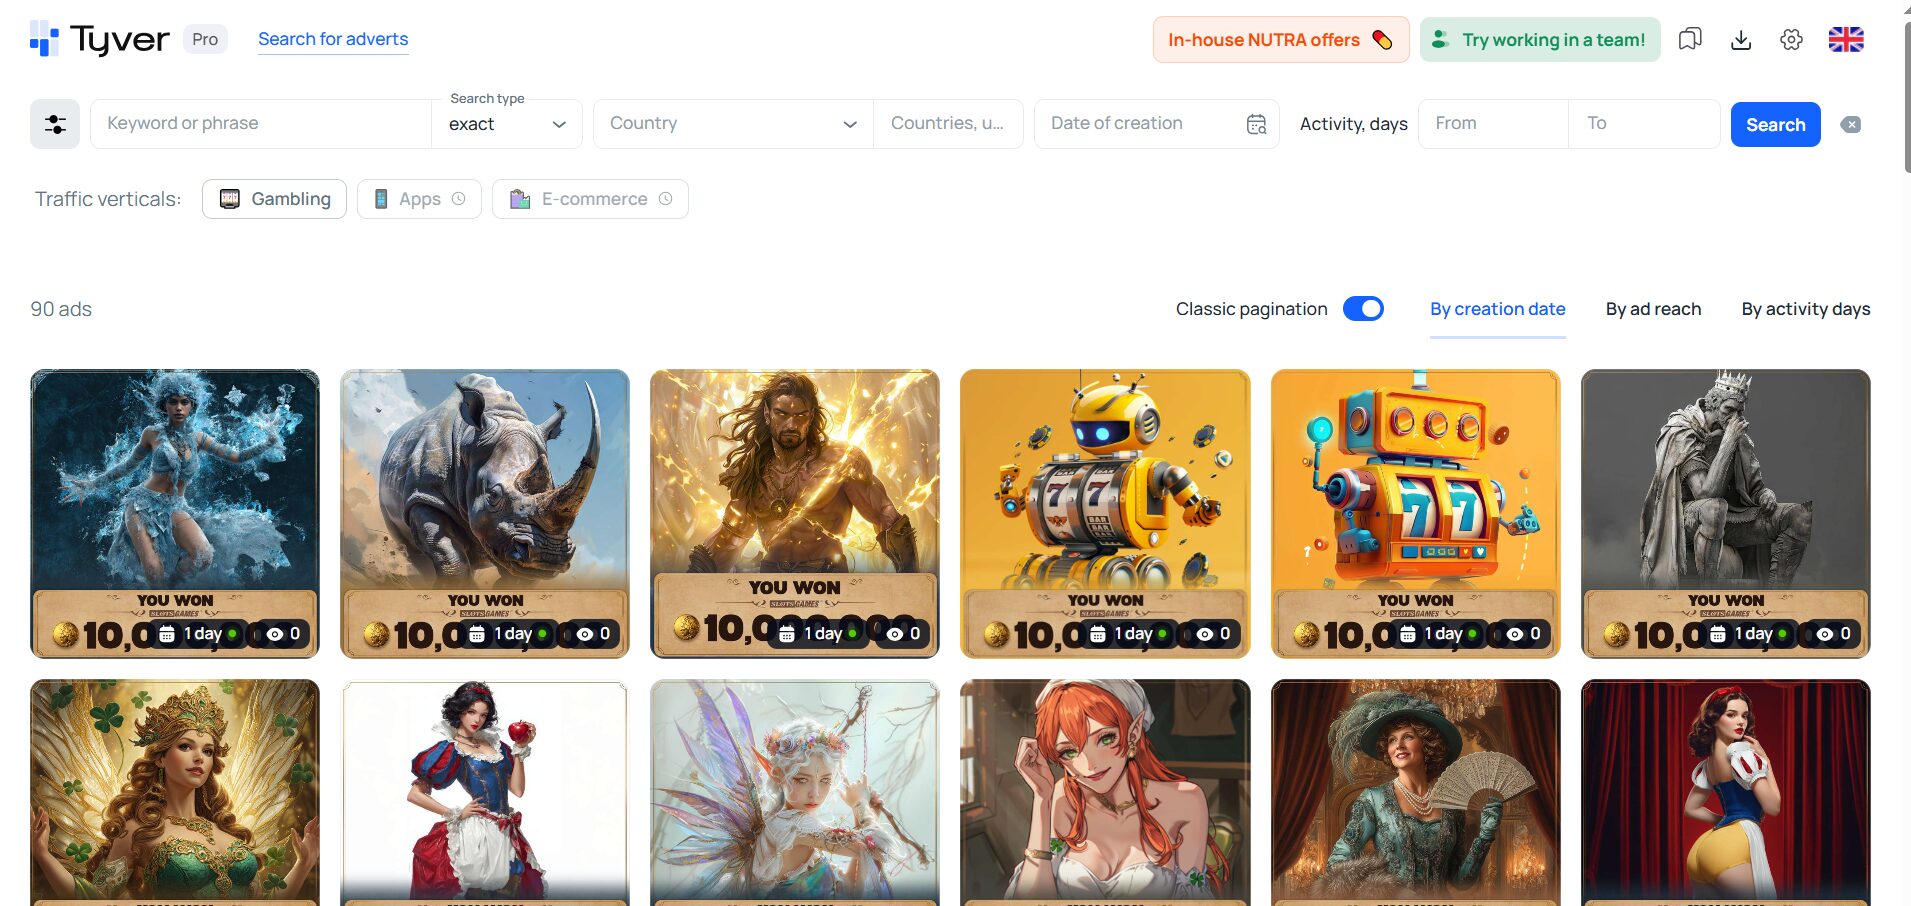
The results should be sorted by creation date. Scroll all the way down to the earliest creatives and check their performance.

As we can see, the first creatives ran for a little over a month. Then the advertiser launched creatives that ran for more than 200 days (about 7 months) 🗓️. After that, new creatives were launched, but they did not last 30, 60, or 80 days. The most recent creatives (at the top) have already stopped getting views and ran for just one day.

Based on this advertiser’s example, we can draw the following conclusions:
- Creatives with slots, sevens, numbers, crystals, and free spins run the longest, even after relaunches. They allow the offer to be “squeezed” again and again to the very end;
- Dull colors, like those in the most recent ads, hardly convert at all and fail to attract attention.
🫡 However, you can’t judge an entire niche based on just one advertiser. You need to find, open, and analyze other advertisers in your vertical. Only by studying many advertisers and forming a complete picture will you be able to successfully generate your own ideas and create creatives for testing.
How to find the most effective ads in Tyver: a step-by-step algorithm
🔍 Creative analysis in Tyver is done as follows:
- Find creatives with the longest run time;
- Go to the advertiser’s fan page;
- Review the history of their ad launches starting from the very first ad. Even if the number of views for a creative is unavailable, its effectiveness can be judged by the number of days it remained active.
Yes, this analysis is not very deep. However, a quick review using Tyver:
- highlights strong and weak creatives in an advertiser’s campaigns;
- provides a complete picture of their launches and ad burnout;
- helps you understand which colors, images, and advertising messages work long-term for your target audience, and which ones will not deliver results.
Conclusion
Budgets are not wasted because creatives burn out, but because advertisers fail to monitor burnout in time and take no action. To effectively combat burnout, you need to understand the advertising landscape in your niche. You don’t need deep research — it’s enough to know who is running which ads and what kind of results they are achieving.
Tyver provides fast and extensive access to this data. It has everything you need to thoroughly study successful advertisers in your niche, learn from their experience, and effectively fight ad burnout. To see this for yourself, sign up and take advantage of the free basic plan.